Trace information serves as the basis for analyzing the root causes of a wide variety of problems that are revealed by system tests on the target hardware.
Intrusive Tracing
Traces can be generated by trace code that is executed within tasks and/or interrupt service routines, just like application code that is executed on the same CPU. This is the most flexible approach, as both the content and the amount of trace information output can be defined in software. However, this tracing method comes with a significant drawback: It uses resources that are shared with the application software, hence tracing may significantly reduce the amount of memory available for the applications, increase the gross execution times of the applications and, in the case of real-time systems, impair functionality. This is why it is called intrusive tracing.
The most common case is that adding trace code is detrimental to the functionality of the applications in real-time systems because the resource requirements for intrusive tracing have been underestimated in the early stages of the project, such that tracing would eventually eat up resources that are required by the application. Therefore, the resource requirements for tracing must be properly considered throughout the whole development lifecycle. Removing trace code from real-time systems may also cause functional issues, typically just before the final production software release. This is the worst case, as trace information is no longer available in this scenario.
Non-Intrusive Tracing
Non-intrusive tracing does not change the intrinsic timing behavior of the system under test. This approach simplifies the software development process a lot and requires dedicated hardware support for tracing. External trace probes connected to the target system, in conjunction with on-chip debug modules, capture code execution on instruction level, memory accesses and other events on the target processor. This approach is the best option when it comes to debugging the code execution down to the instruction level. The PCB design of the device under test must provide the connectors required by the external probe.
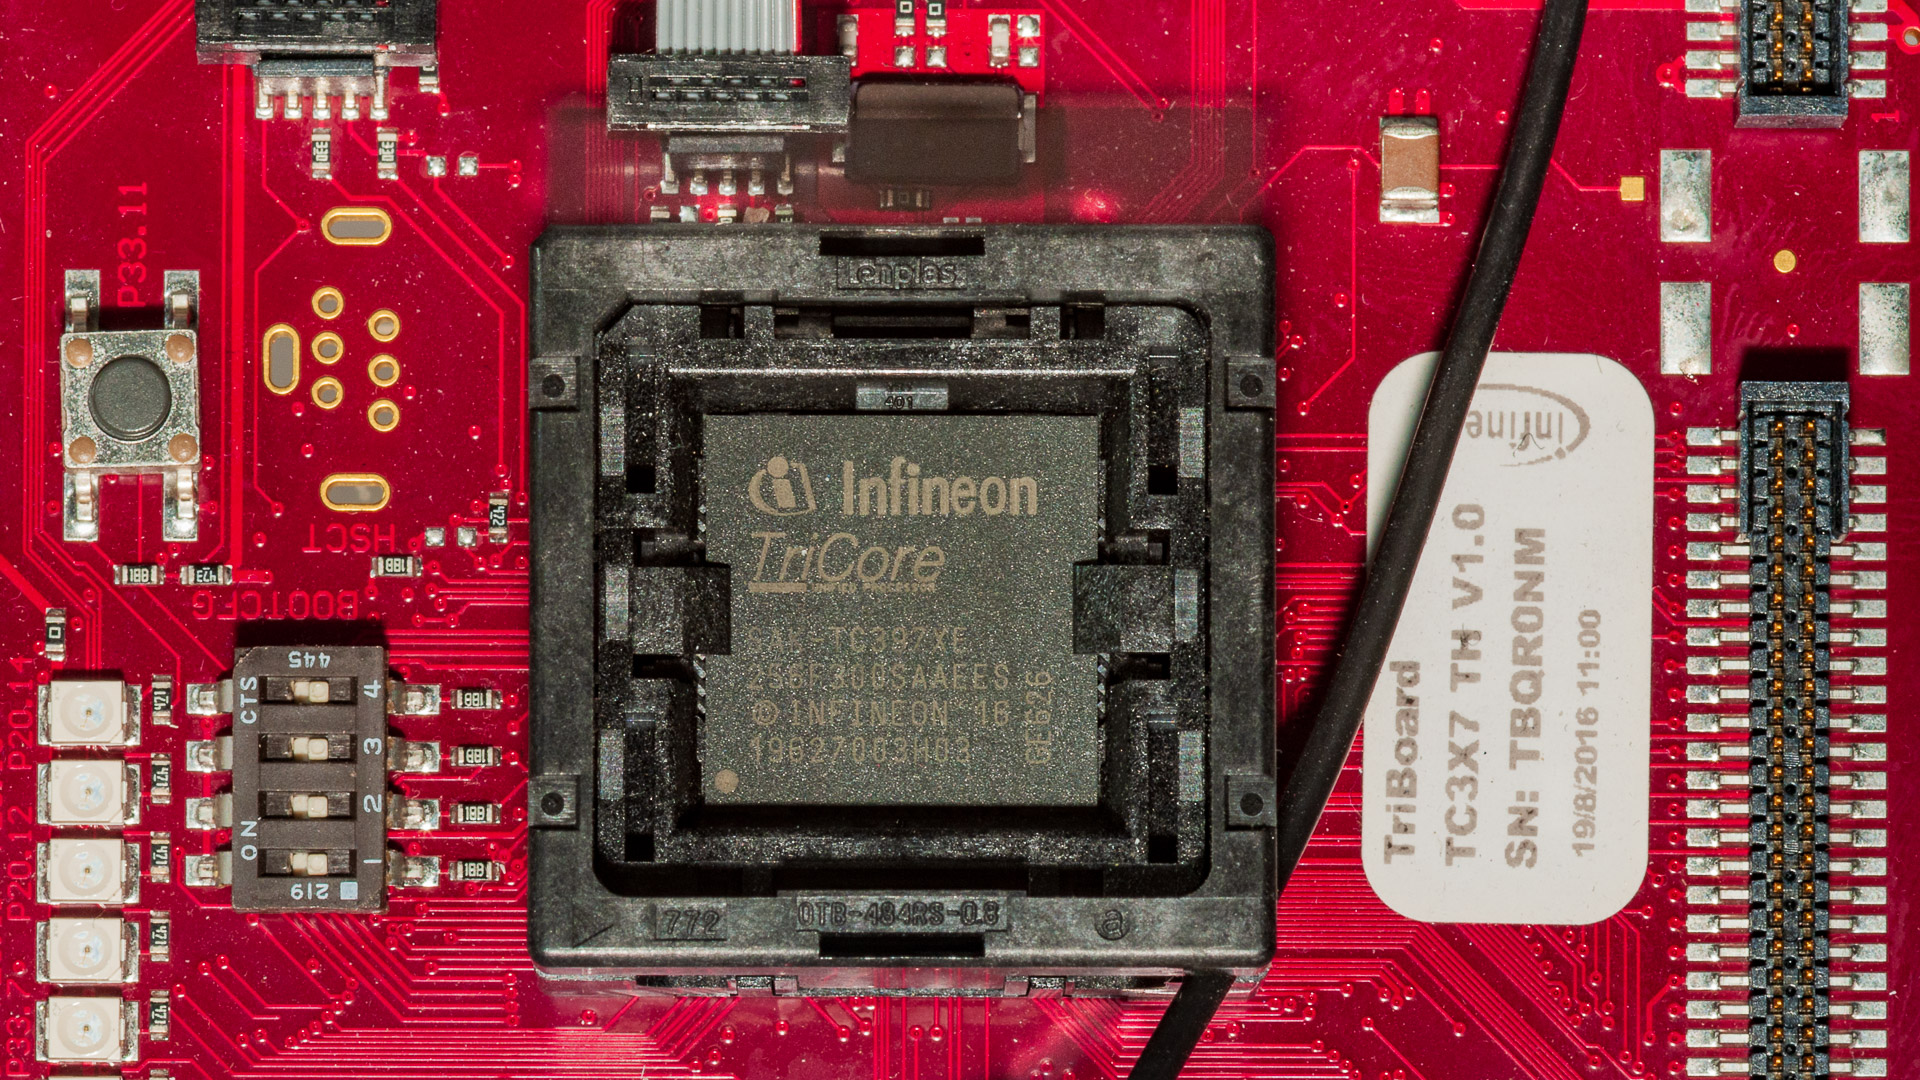
Another option for non-intrusive tracing is on-chip tracing, where most of the trace hardware is packed into the same chip that also contains the CPU that executes the application code. Non-intrusive tracing can, however, be restricted by limitations of the respective trace module or probe, such as buffer sizes, bus bandwidth or the size of an external probe.
Due to cost savings (no expensive third-party trace hardware required), reduced footprint (very small connectors instead of larger probe connectors), and limited trace bandwidth requirements, the on-chip tracing method is the preferred approach for generating the trace data required for in-depth timing analysis on task, runnable and ISR level. On-chip tracing is a suitable tracing method for devices under test with form factors very close to the final volume production devices.
Learn more about how to benefit from non-intrusive on-chip tracing for comprehensive timing analysis on the Infineon AURIX platform

