Customized Requirement Evaluations Using the INCHRON Metric Framework

What’s a Metric Framework?
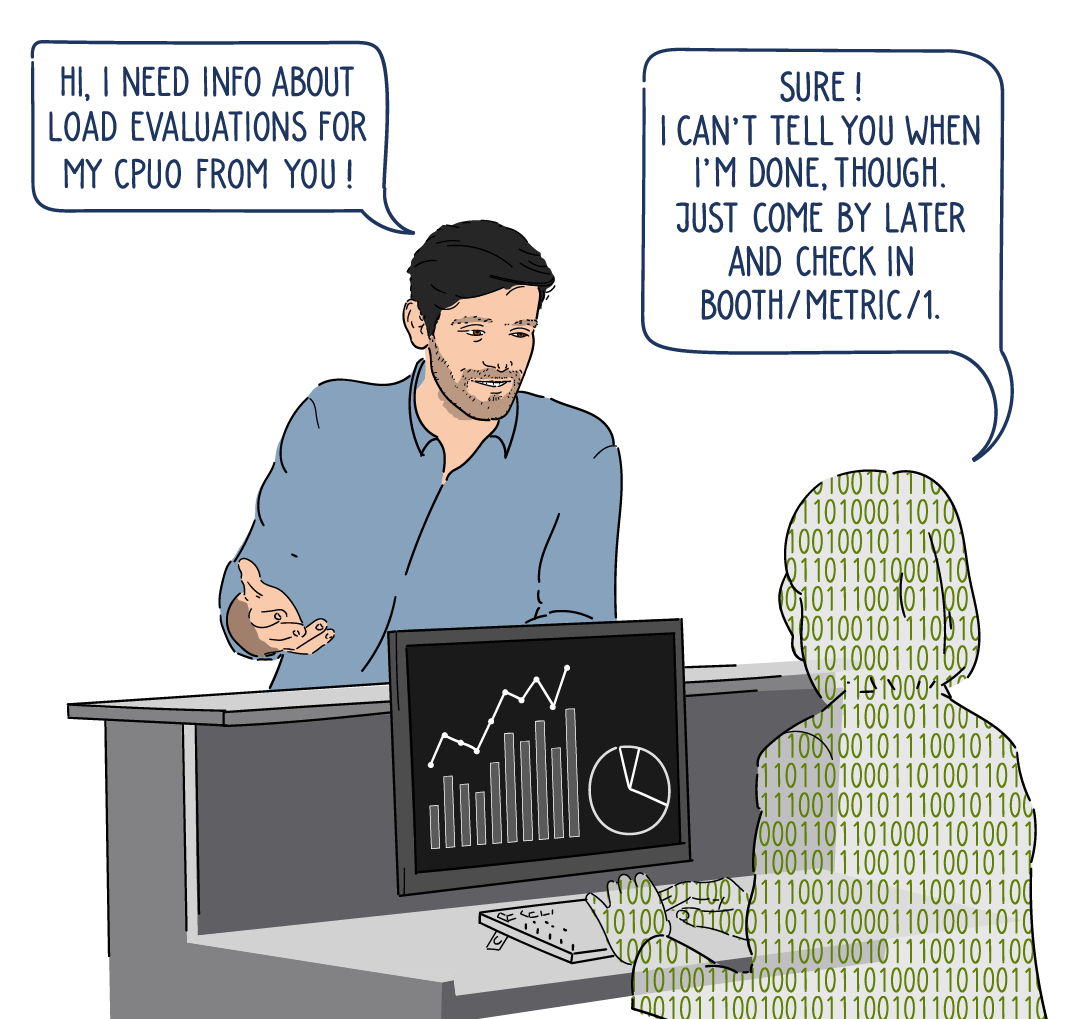
When analyzing a trace, we look at as many aspects of this trace as we can imagine – or as our tools allow us to. The more sophisticated a tool is, the more options are available for querying. However, being bound to a restricted set of options is not INCHRON’s view on timing and trace analysis. We know that specialized applications require specialized questions to be asked. And these questions can now be created in the form of customized metric templates using the INCHRON metric framework.
The metric framework provides several modular basic blocks that can be combined using a descriptive metric template language. Basically, we chain these basic blocks together to give shape to the value we need to observe. These metric templates are then simply imported into chronSUITE, ready to be used.
Metric templates are a modular way to define specific calculations (or measurements) that are applied to the entire trace in order to obtain information about it. The end-to-end latency histogram or mean slack time are prime examples of such templates. They are made up from individual metrics that, in turn, correspond to the processing steps of the overall calculation. These processing steps can stem from the following categories:
- Measurement of timing data – net execution times, end-to-end latencies,
- Statistical calculation – mean, median, histogram, etc.,
- Post processing – filter, smoother, comparator, etc.
Since the individual metrics are chained together, we often refer to metric templates as metric chains.
As an introductory example, we show the creation of a response time measurement metric. The generic ProcessExecution metric produces a set of measurements for every process execution. In order to filter the response times, this metric has to be chained with a fitting selector. To achieve this with chronSUITE, the developer creates an empty metric template and adds a ProcessExecution metric as well as a ProcessExecutionSelector metric. These metrics are chained together via the source property of the selector. Now, when calculating this metric template for a trace’s process, a measurement is created for each process execution that is subsequently available as JSON data via the REST API. The actual inner workings of the metric framework are explained later in this series.
So, in a nutshell, using such templates allows measurements or requirements to be generated, parametrized, and applied to a trace to obtain evaluations. This process can even be automated using a REST API and INCHRON’s report.py script. In essence, metric templates enable you to create machine readable questions to the trace (your requirements) that are answered by chronVIEW (the evaluations).
The next parts of the metric framework series of posts will focus on the following aspects:
- The report.py and the REST API
- Building metrics using ecore (and the documentation)
- Do-it-yourself metrics
So, stay posted for further information.
A RESTful Metric Framework
Introduction
When tackling challenging timing issues, gaining access to as much data as possible is critical.
In part 1, we introduced the concept of metric frameworks, a method of defining standard measurements that we wish to pull from our server to support our analysis. In part 2, we examine the implementation process using our REST API.
Trace Analysis with REST
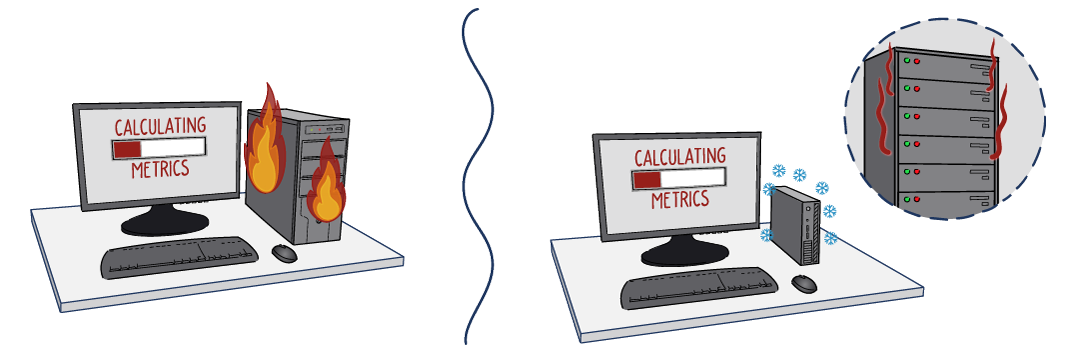
With the growing complexity of today’s embedded software applications, it makes sense to use the power of a server for analysis rather than rely solely on your workstation. This places the complexity of the calculations on powerful hardware that can also be shared with other developers.
This is especially relevant for analysing extensive real-time traces of the complex HPCs (high-performance computers) now in use throughout the automotive industry. To support this, Inchron has created a trace analysis server called metrics that conforms with REST (REpresentational State Transfer) principles, allowing it to be queried over the network.
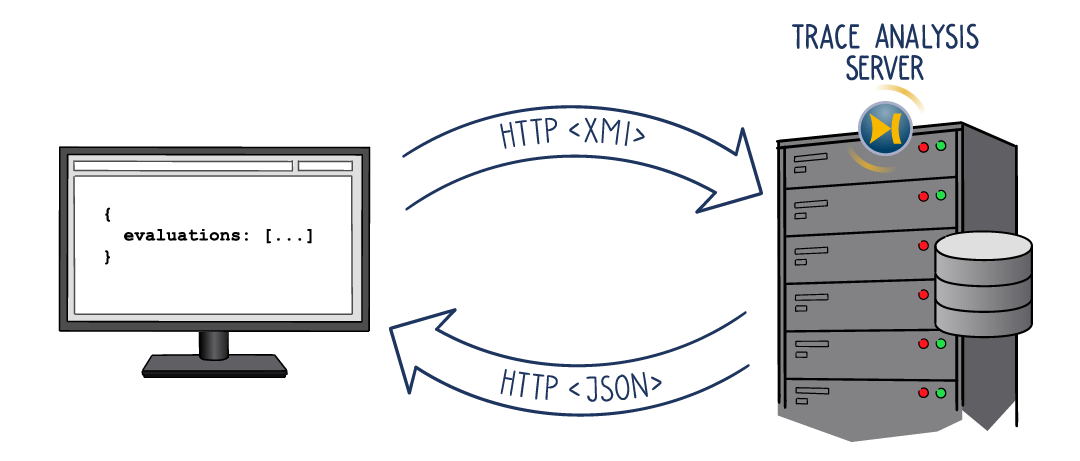
REST is a straightforward method to obtain resources – or simply data – from a remote source. Communication is simple, using the HTTP protocol for which everyone has a suitable application already installed, the browser.
A REST API has six basic principles:
- A uniform interface to interact with resources.
- A Client-server approach.
- Stateless communication and interaction – no session, no history.
- Cacheable resources that reduce transmission overhead.
- A layered system supporting distributed servers to spread the workload.
- Endpoints that can deliver executable code on demand.
Resources in this context are either the elements of your real-time model (processes, CPU cores) or a particular query, termed “metric”, that you request based on the trace under analysis.
The metric framework responds to several endpoints:
- The /info endpoint delivers static operational information.
- Trace or model-related information is acquired using the /trace or /model.iprx endpoints.
- Endpoints for model objects, such as /process, /cpu, /cpucore, and /functions.
- The sophisticated /metric endpoint that responds with dynamically created metric resource objects and executes custom calculations.
Where applicable, endpoints are easily queryable via a path-like syntax. Generally, responses from the Metric REST API are JSON data structures, making subsequent processing, e.g., for scripting languages, simpler.
For a complete reference, each chronSUITE installation includes a REST API manual in chronVIEW for the entire REST API, including all available endpoints under
- Help → REST API Manual or via
- %INSTALLPATH%/doc/en/REST API/index.html.
Creating a Metric Resource
The metric chains, which were introduced in Part 1 of this series, are specified using the INCHRON Ecore meta-model. Ecore is a meta-model for describing models using the Eclipse Modeling Framework (https://wiki.eclipse.org/Eclipse_Modeling_Framework).
The development team uses the metric chain part of the INCHRON meta-model to create a metric model whose XMI representation can be transmitted easily via the network. When passed to the trace analysis server, it creates a metric resource and starts its evaluation. The successful response to the creation is the location of the new metric resource.
When querying the location of a metric resource, the corresponding response contains the state of the metric resource evaluation and, eventually, the calculated data. Optimizations are also implemented to create multiple metric resources as the evaluation results are collected.

REST API in Action
To use the REST API, a metrics server instance must first be started on a server. For initial testing and evaluation, this can also be your workstation. A trace file will also be needed when starting the server. The example covered here uses the PreemptiveScheduling example, a project delivered with every chronSUITE installation. To create the trace, simply open the example in the chronSUITE editor, perform a simulation, and save the resultant output as isf in a directory of your choice.
For the following examples, curl commands are used to send requests from within a Linux environment. To create a metrics server instance, call:
$/opt/inchron3/bin/metrics –no-auth /path/to/PreemptiveScheduling.isf
2022-06-01T07:36:07.455Z Metrics server is listening on address 127.0.0.1:6809
The server’s outputs the port the server communicates on. We recommend using the –no-auth option only in closed networks. For security reasons, the metrics server only binds to localhost by default. Please consult the REST API Documentation before running the metrics server on a TCP port that can that is reachable from other machines.
Requests can now be sent. A sample request is shown in the table below using a iprx file. In <part 1> of this series, the concept of metric templates was introduced. These request specific calculations that are performed by the trace analysis server. Using .iprx files for template descriptions eases manual testing and querying of the metric framework. In this example we select the ProcessExecution template:
Request
$curl -i –data-urlencode \ iprx@/traces/metricTemplates.iprx \–data-urlencode \ “template=ProcessExecution” \–data-urlencode \ “process=_3Tp5yQSkTK+qSMR1gOjzbQ” \ http://localhost:6809/metric
Reply
HTTP/1.1 201 Created
location: /metric/26
content-length: 0
connection: close
date: Tue, 31 May 2022 13:31:01 GMT
The metricTemplates.iprx are available for download here.
The result can be requested by issuing the following command.
Complex requests will take longer to calculate.
Request
$curl http://localhost:6809/metric/26
Reply
{
  "evaluations": [
    {
      "gross": "2.050735284 ms",
      "initialPending": "121.122 us",
      "net": "1.741312166 ms",
      "preemption": "430.545118 us",
      "range": "0 us - 2.171857284 ms Δ 2.171857284 ms",
      "response": "2.171857284 ms",
      "slackTime": "2.828142716 ms",
      "startToStart": "NaN"
    },
    …
  ],
  "process": "_3Tp5yQSkTK+qSMR1gOjzbQ"
}
The evaluations array from the received JSON data contains all the relevant information and, thus, may be very long. The resultant data is then available for futher processing. The trace analysis server can then be shut down if no further requests are to be sent.
Within chronSUITE, our reporting leverages the REST API to calculate and visually prepare the results. It defines several standard queries for efficient trace analysis, formatting the results as .xlsx or .pdf. This python-based implementation for reporting and its REST API is easy to trial as the scripts are included with every chronSUITE installation – simply take a look in chronSUITE’s Python directory.
Questions?
Feel free to drop us your questions on the metric framework using the form below.


